

Disclaimer: I am a lover of data.
I had some time play with some of the data in ATD’s State of the Industry Report and it raised some questions for me. In order to better understand the ATD data, I looked at the “implied” results that are not included in the report. Because ATD includes data such as percentage of revenue and percentage of profit I can simply reverse the calculation to see what the trends are for both revenue and profit per employee. Since these are the ultimate measures of the success of learning, the trends in these should be trending positive or at least correlated to the investment in learning being made by organizations.
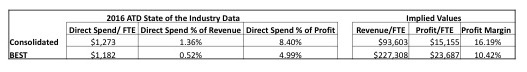
The first thing that stood out was the delta between the implied revenue per employee (RPE), a common public market metric, and the profit per employee in the ATD report and the S&P 500 average. According to Yardeni, an economic advisory, the 2016 Average RPE for S&P 500 ranged from $321,000 and $1.7 million depending on industry with a profit margin of approximately 10%. The revenue discrepancy for Consolidated cohort is understandable given the smaller size for many of the reporting companies for the ATD data. The comparison to the BEST cohort is closer but still under the S&P averages.
The comparison to profit per employee was similarly off.

I then looked for a correlation between learning and an impact on revenue and/or profit in two ways. First, I looked to see how the numbers compared year over year. I then looked for a correlation between learning and an impact on revenue and/or profit in two ways.
First, I looked to see how the numbers compared year over year. This view showed that the increased percentage of investment in learning, touted as a positive reflection on businesses opinion of learning in the ATD report might be misplaced. The ATD report states “Confirming organizations’ commitment to learning, this indicator [% of profit] grew from 8.3 percent in 2015 to 8.4 percent in 2016; the ratio has climbed steadily for four years in a row.”
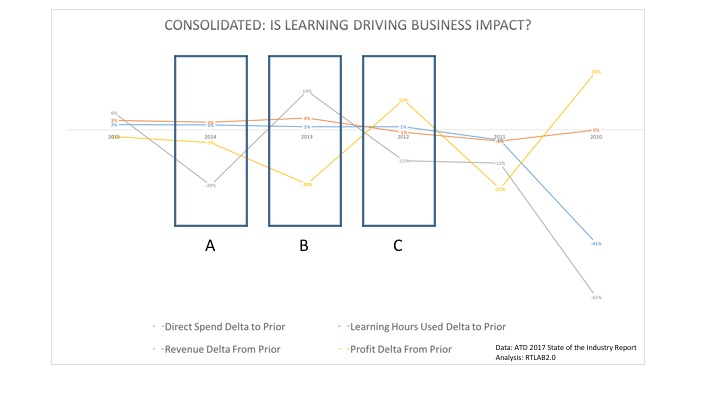
While ATD seems to draw a positive connection, in fact this may simply be a case of reported profit and revenue dropping, things that businesses care about. There appears to be no correlation. The resulting chart shows years where learning hours rose and the implied profit or revenue dropped. If there is a return to be captured from learning, the ATD numbers don’t seem to reflect it. I did a similar look lagging the revenue and profit a year, to let the impact of the learning spend sink in. Still nothing that showed a correlation much less a causation.
As I stated in the post on benchmarks, be careful.

2 thoughts on “Some L&D Math and Some Questions”